The rate at which cities and towns grow, the urbanisation rate, is an important indicator of the sustainability of towns and cities. Rapid, unplanned urbanisation can result in poor social, economic, and environmental outcomes due to inadequate and overburdened infrastructure and services. The outcome can lead to congestion, worsening air pollution, and a shortage of adequate housing. The first requirement for addressing the impacts of rapid urbanisation is to accurately and regularly monitor urban expansion to track urban development over time.
Why is this Important in Africa ?
The UN 2030 Agenda for Sustainable Development Goals (SDG 11)1 calls on governments and all stakeholders to make cities and human settlements inclusive, safe, resilient, and sustainable. Urbanisation in Africa is projected to be among the fastest in the world this century. According to the UN’s median projections, Africa’s population is expected to nearly double from ~1.34 billion in 2020 to ~2.49 billion by 2050, most population expansion is occurring in medium sized cities and towns2.
Knowing the precise locations and rates of urbanisation provides decision makers with key information on where to target urban planning policy. Earth observation datasets, such as those available through the Digital Earth Africa (DE Africa) platform provide a cost effective and accurate means of mapping the urban extent of cities.
Available Analysis Tool
The Urban Index Comparison notebook is an analysis tool that demonstrates the use of multiple remote sensing measures of urban extent. In the remote sensing literature, there are many different urbanisation indices with different characteristics that are useful for different use cases. It can be useful to compare the performance of several indices for an area - determining which is the best for an area based on the outputs and a "ground truth" dataset of urbanisation.
This notebook allows a user to compare different urban indices over their region/city of interest to test its usefulness at accurately delineating urban extent. Results are compared with the Global Human Settlements layer. This notebook is a good place to start before proceeding to a more complex or definitive analysis as it allows for understanding how accurate a particular measure is at mapping urban extent.

Comparisons between three urban indices, NDBI, ENDISI, and Fractional Cover (bare soil) and the Global Human Settlements layer for the year 2014.
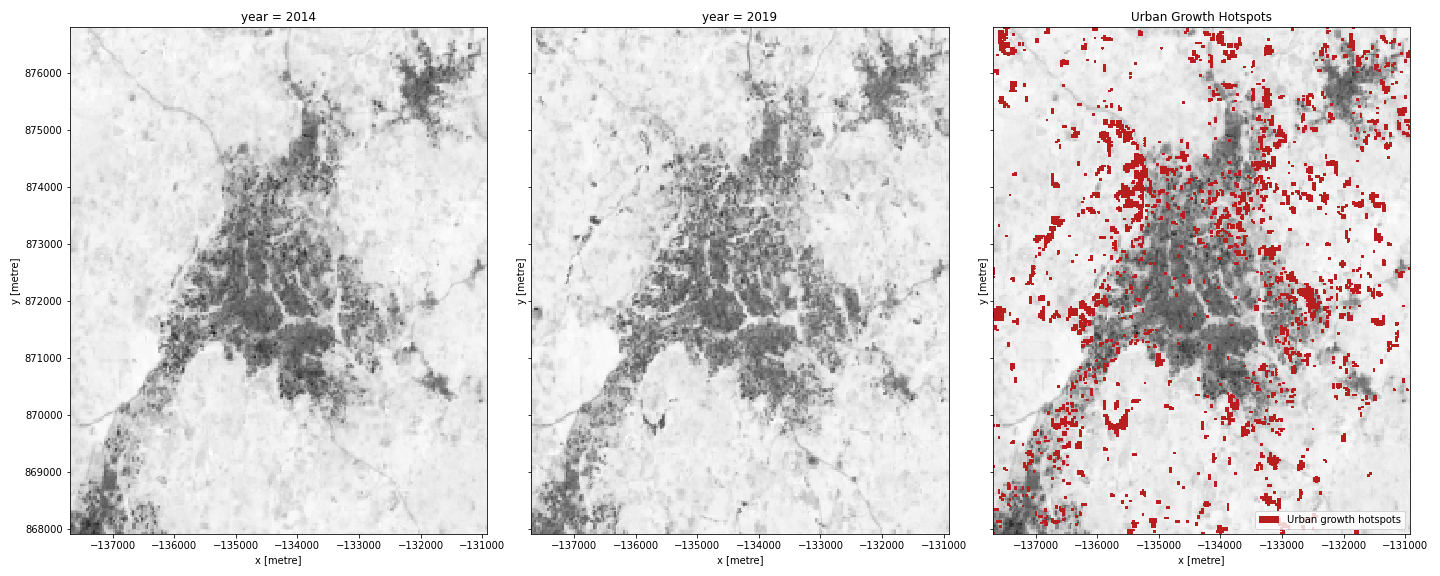
The Urban Extent Change Detection notebook is an analysis tool that monitors urban expansion in order to track urban development over time. Using Landsat 8 satellite imagery, the change in urban extent between a baseline period and a more recent period is estimated. The difference in urban extent (area is square kilometres) between the two periods is calculated, along with a map highlighting the locations of urban growth hotspots.

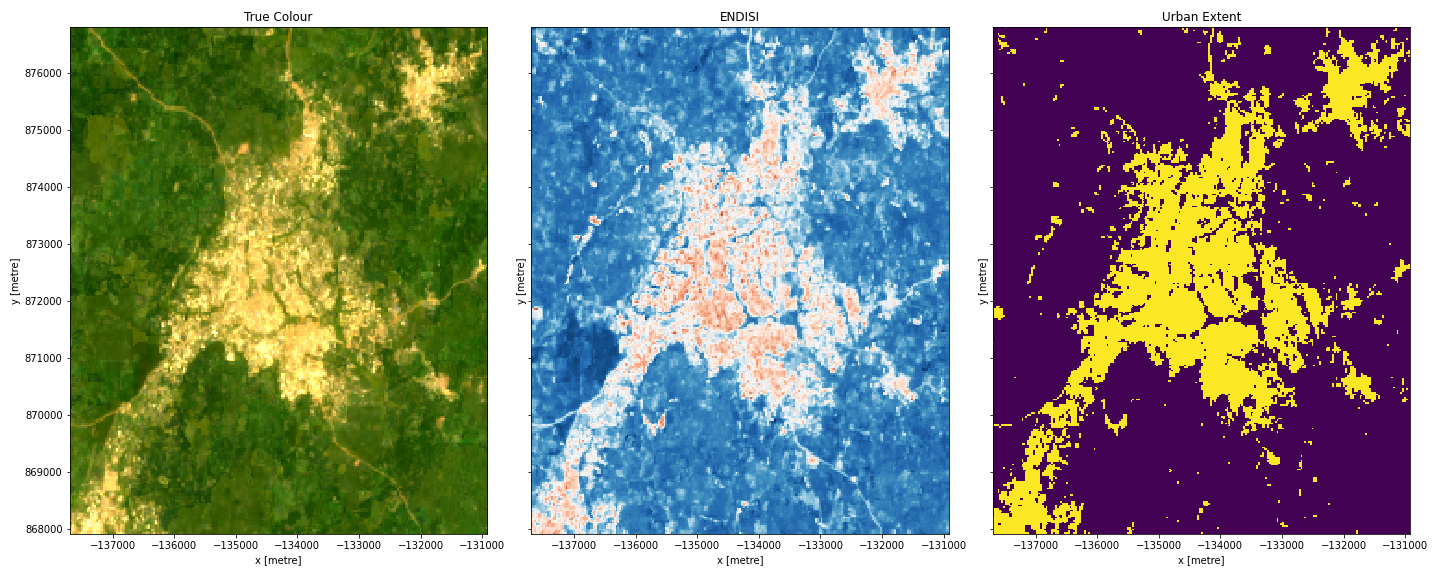
Detecting urban extent using the Enhanced Normalized Difference Impervious Surfaces Index (ENDISI). Location is Effiduase, Ghana
Additional potential technical products and services addressing urbanisation issues are outlined in DE Africa’s Technical Roadmap, which guides the development of our infrastructure and services.
Data Sources and Validation
Our urbanisation services currently use multi-spectral observations sourced from the European Commission Copernicus Sentinel-2 satellite imagery archive.
The primary goal of the data validation strategy within the context of DE Africa is to provide confidence in the data services while also highlighting the limitations – where it works and where it fails – in order to enable the appropriate application by the end users. We will be actively working with African partners to assess the accuracy of future continental scale urbanisation products across the diverse environment of Africa.
Services, Products and Training
We are committed to provide a suite of services that cover the entire African continent, including analysis-ready datasets and services that translate Earth observation data into meaningful information for users.
There are a number of services all aimed at providing access to DE Africa data.
- The DE Africa Map offers user friendly map-based access to spatial data.
- The DE Africa Sandbox is a cloud-based user computational platform that operates through a Jupyter Lab environment providing users with access to data and analysis tools, democratising access to remote-sensing data to allow for ad-hoc report generation and rapid development of new algorithms.
- The Notebook Repository offers readily available notebooks (user computational workflows and code) to support advanced users to use, interact and engage with the DE Africa Sandbox.
With the help of our stakeholders we have co-designeda free self-paced online training program available on the Learning Platform to support users to work autonomously on the DE Africa platform. The training material includes modules made up of videos and recorded tutorials, manuals with hands-on exercises, live workshops and access to experts to get more help.
1United Nations General Assembly, 2015. https://www.un.org/ga/search/view_doc.asp?symbol=A/RES/70/1&Lang=E
2United Nations Population Division, 2019. World Population Prospects, https://population.un.org/wpp/Download/Standard/Population/