We have a comprehensive set of open source example notebooks and Python tools to enable Earth observation on the DE Africa Sandbox. Each analysis represents different methods of analysis with code, and demonstrates results through plots and visualisations. The Sandbox comes pre-loaded with these examples, which we call notebooks, and which can be interactively accessed in the Sandbox platform without prior coding experience. Sandbox users can also easily copy and modify any of the example “notebooks” to tailor to their own area of interest.
Take a look at a selection of our analysis tool notebooks, for the full list see the Notebook Gallery. These example analysis tools notebooks are regularly updated and improved in consultation with end users and partner institutions.
Water resources and flood risk
Our water resource analysis tools address various water monitoring and management issues. You can also use the tools to generate time series and analyse single water bodies over multiple years.
Monitor chlorophyll-a in waterbodies: Visualise the presence or absence of chlorophyll-a on the surface of water bodies. Using Sentinel-2 imagery the presence of water and NDCI measured to indicate the presence of chlorophyll-a. These can be combined to generate a visualisation of the analysis. This can be used to assess the presence of algae which is an important food source for animals such as flamingos in Lake Elmenteita in Kenya.
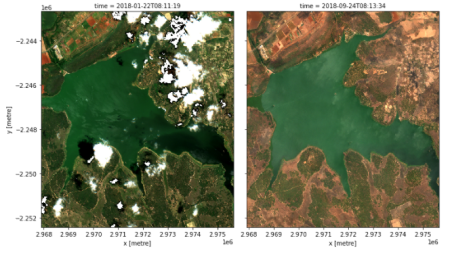
Long-term changes in water extent: Building on the breadth of the Landsat satellite archive, the Water Observations from Space service (WOfS) clearly identifies changes in waterbody extent over a 30-year period for Lake Sulunga, Tanzania. The notebook explains how to use annual summary data from the Water Observations from Space service to analyse and visualise long term change to water bodies. It can be used to assess the long term effects of climate or develop water management strategies. The effect of flooding of the Rift Valley Lakes was assessed using DE Africa tools and services.
Agriculture and food security
A robust understanding of land and vegetation is fundamental for agricultural monitoring. Digital Earth Africa tools use our data services to allow the calculation and comparison of relevant indicators and standardise anomalies to remove seasonal variability and highlight change related to longer term drivers.
Inspect vegetation anomalies: To understand the effect of long term climate drivers on vegetation requires understanding of seasonal anomalies. This notebook helps to compare seasonal rolling averages to the long term mean to remove seasonal anomalies and highlight change in the vegetation from longer-term drivers such as climate.
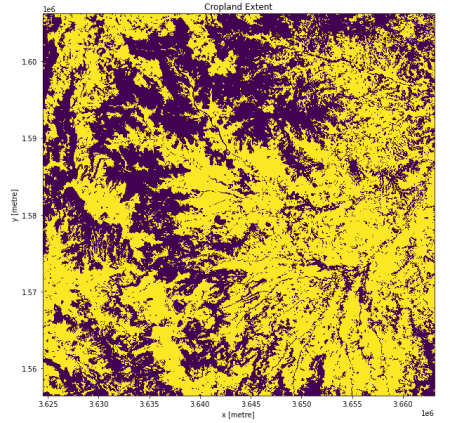
Measure crop health: Using Sentinel 2 imagery, assess the health of crops through the Normalised Difference Vegetation Index (NDVI), or the reflectance of vegetation cover. Use an interactive widget to outline areas of interest, such as adjoining paddocks. The notebook automatically calculates and compares vegetation trends over a two-year period. Requires Sandbox for interactive widget.
Land degradation and coastal erosion
Understanding the change of the coastline across Africa and the impact of humans and a changing climate on coastal ecosystems, such as Mangroves, is critical to decision making for ecosystem management. These tools help identify indicators of erosion and change in extent of mangroves and complement further analysis.
Monitor mangrove extent: This notebook uses Sentinel-2 data to use the best available imagery for each year to measure the change in mangroves using NDVI (reflectance) values. Mangrove shapefiles provided by Global Mangrove Watch (Bucomil, Guinea-Bissau) are used as a baseline for indicating change to mangrove extent and to identify and classify mangroves.
Shoreline contours for coastal erosion: Using aerial imagery from Landsat, this notebook maps the shorelines over time. A combination of Landsat satellite data and tidal models over annual scales allow the identification of coastal erosion and accretion, as well as anthropological constructs. It can be used to assess long term change to the coast due human or natural impacts.
Urbanisation
Using remote sensing tools makes it accessible to assess the sustainability of population growth in cities and towns across Africa for informed decision making.
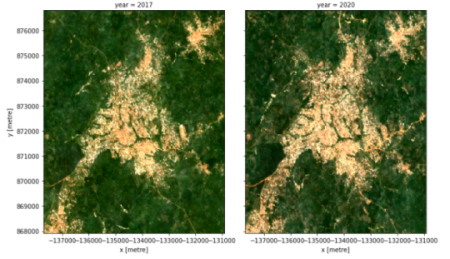
Urban area change: Map and calculate the urban extent of a city or town in square kilometres using Sentinel-2 satellite data. Visualise and quantify the change over a period of several years by assessing growth via satellite imagery. This notebook can also calculate the extent of impervious surfaces (concrete) which could be input into analysis of water runoff and effect planning decisions
… and more:
- Identify ships in the Suez Canal using radar backscatter to identify the position of ships.
- Use machine learning to classify urban areas in Kampala, Uganda
- The interactive Wetlands Insight Tool provides a clickable user interface for investigating wetland extent and analyse seasonal changes. Requires Sandbox for interactive widget.
Explore the full collection of real-world analysis tools in the User Guide, or log in to the Sandbox to interact with them.
New to DE Africa and the Sandbox? Explore the Help Desk for useful materials such as User Guides, Knowledge Base articles and answers to your FAQs. For more detailed training on using the tools see the ‘Introduction to Digital Earth Africa Sandbox’ self-paced online course available in English and French.