 English
  Português
  Français
  العربية
 Digital Earth Africa
Mean NDVI and Anomalies
An Analysis Tool Indicating Vegetation Health
The Service provides a monthly indicator of vegetation health, and how this compares to the long-term average conditions across all African countries. This is determined by measuring how different the vegetation health is each month compared to the long-term mean for that month, measured in standard deviations.
The Service is designed to give users insight into how much the current vegetation conditions have changed relative to historic conditions, with the long-term baseline condition based on the period from 1984 to 2020. It can show improvement, maintenance or deterioration of the vegetation at each 30m pixel across the continent, including insights into cropping patterns and variations in agricultural productivity.
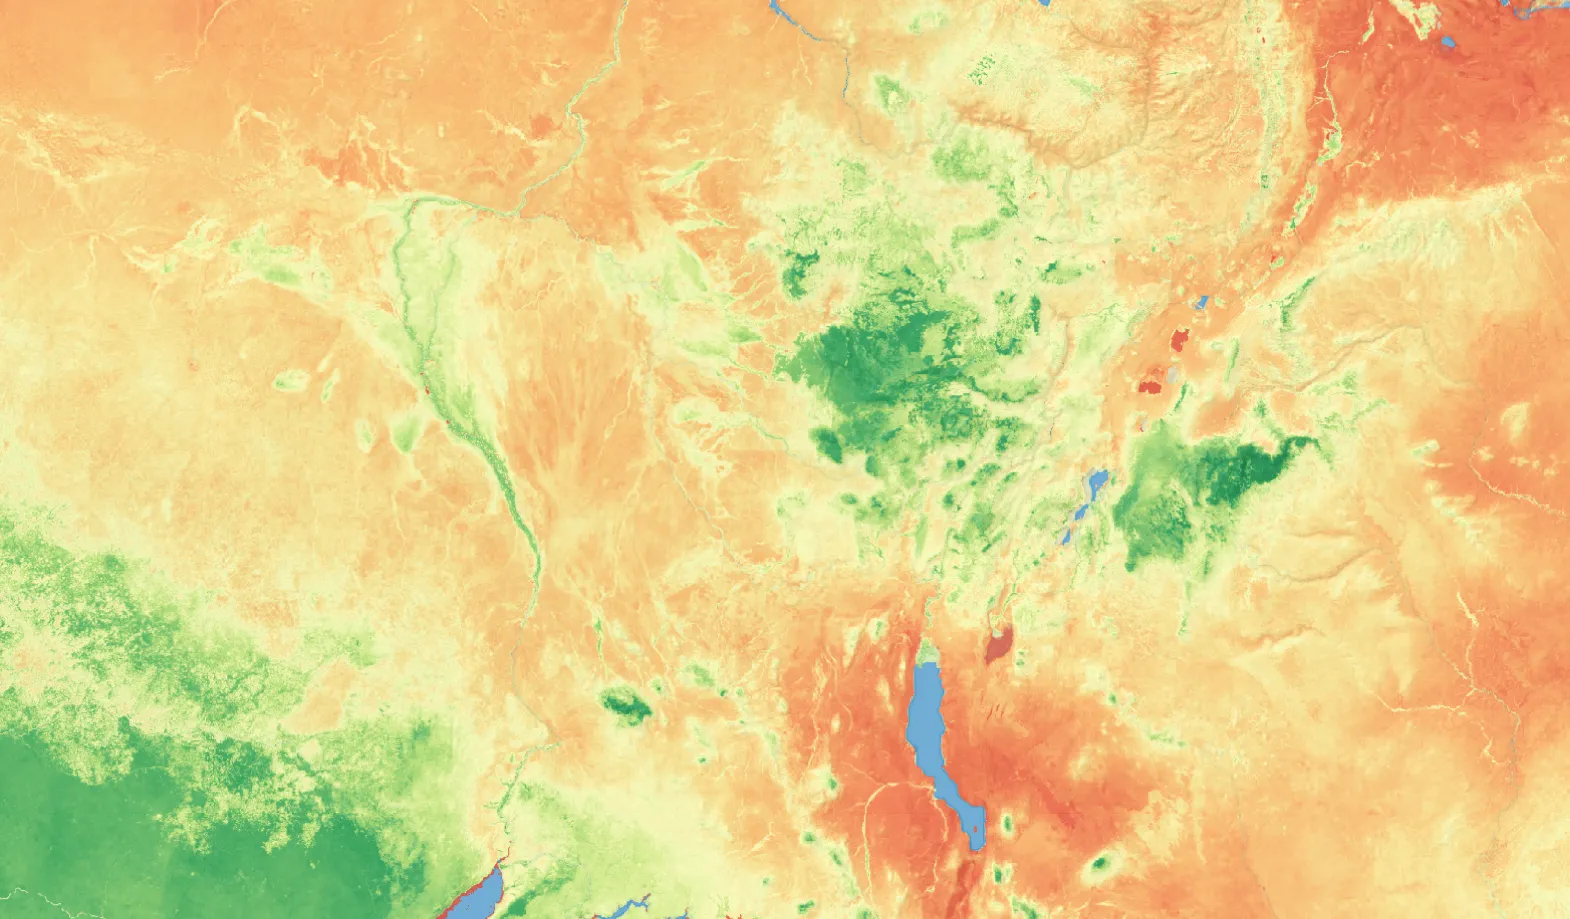
NDVI Anomalies across Africa from 2017-2022
Key Features
Climatology
The long-term baseline condition used in the calculation of the NDVI anomalies component of the Mean NDVI and Anomalies Service is measured based on the period from 1984 to 2020 and is available through the NDVI Climatology Service.
Changes in Vegetation Health
The Service provides data monthly from January 2017 onwards at a spatial resolution of 30 m, and is designed to identify relative changes in vegetation health including the extent, intensity, and impact of drought conditions when compared to the long-term mean.
Low Latency
The Monthly NDVI Anomaly is generated as a low latency product, i.e. the anomaly for a month is generated on the 5th day of the following month. This ensures data is available across the continent shortly after the end of a month.
Digital Earth Africa
Mean NDVI Multiple Applications
If the NDVI anomaly is positive this indicates that the vegetation is greener than the average conditions, usually suggesting an increased rainfall in a region.
A negative anomaly indicates that the vegetation may be stressed due to drier conditions. The anomaly can also indicate the extent, intensity, and impact of drought conditions when compared to the long-term mean, and an abrupt and significant negative anomaly can occur following a fire.
Examining the anomaly against the NDVI Climatology can confirm the impact of weather, such as rainfall patterns, on the areas observed. As well as accessing via the data catalogue, explore Mean NDVI and Anomalies via the Digital Earth Africa Map.
Applications
Crop Health Monitoring
Track crop health and identify areas of stress to inform decisions about irrigation, fertilization, and pest control, estimate potential crop yields and predict harvest times.
Early Warning Systems
Tracking vegetation health over time can help develop early warning systems for drought or other crop stress conditions. It can also inform decisions about resource allocation for disaster response and rehabilitation efforts.
Deforestation Monitoring
Monitor deforestation rates and assess the impact of land-use changes on vegetation including fires.
Drought Monitoring
Identify areas experiencing drought conditions and monitor the evolution and recurrence of drought conditions.
Vegetation Dynamics
Provides a proxy for vegetation status and can be used to study vegetation dynamics, including plant biomass, phenology, and stress responses.
Climate Change Impacts
Long-term NDVI data can be used to assess the impacts of climate change on vegetation patterns and ecosystems.
Related Use Cases
September 22, 2025
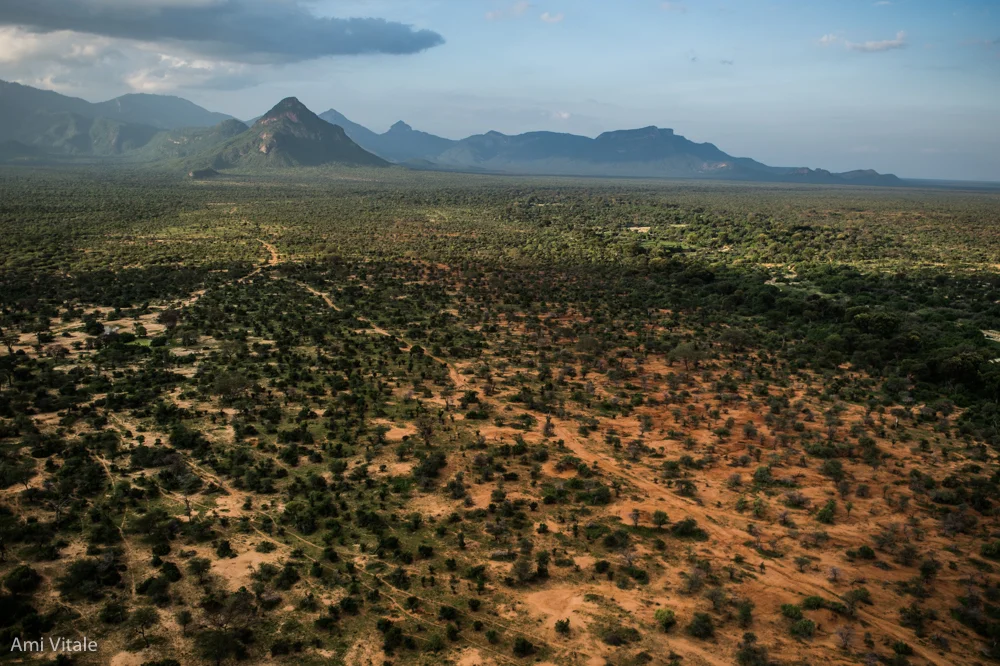
Monitoring rangeland health for increasing ecological and economic resilience of Northern Kenya communities

June 13, 2025
Accessible from anywhere: How Digital Earth Africa is changing the way we use satellite data